How to View Stock Price Fluctuations? 5 Key Techniques
「How to interpret stock price fluctuations?」 This is the most urgent question that every new investor wants to know. In markets such as the Taiwan stock market, U.S. stock market, and Hong Kong stock market, the fluctuations in stock prices affect the heartbeat of every investor. According to surveys, investors who master technical analysis have an average return rate that is 35% higher than that of blind traders. However, beginners often incur losses due to misjudging signals of price increases and decreases. This article will teach you step by step how to establish a complete judgment logic from technical analysis, fundamental interpretation to market psychology, allowing you to use professional methods to grasp the timing of buying and selling!

Why is understanding the ups and downs of stocks the key to making money in investing?
Most people often fall into the trap of “buying high and selling low,” and the root cause lies in the lack of a systematic analytical framework. For example:
- Short-term fluctuation:TSMC (2330) may rise or fall 3% in a single day due to quarterly results
- Long-term trend:The AI industry chain is driven by global demand, and relevant stocks have risen by more than 50% annually
To avoid being led by the market, data tools and analytical methods must be combined. Choose a reliable professional broker, master practical charts and real-time market, help you quickly interpret long and short signals, reduce the risk of blind orders.
The basic concept of stock prices: Understanding the meaning behind the numbers
Before learning how to predict stock rises and falls, first master the 5 basic price fundamentals:
- 1.Opening Price:The first transaction price of the day reflects the overnight market sentiment
- 2.Closing Price:The last transaction price determines the basis for the price fluctuation limit for the next day
- 3.High point/Low point:The daily stock price fluctuation range, determining the bullish and bearish forces
- 4.Price fluctuation calculation formula:
(Current price – Previous day’s closing price) ÷ Previous day’s closing price × 100%
Example: TSMC (2330) closed at NT$780 the day before yesterday and NT$800 today. → Increase of 2.56%
Ultima Markets Reminder:Using the platform’s built-in Transaction Calculator, input prices are automatically converted to potential profit and loss, avoiding manual calculation errors.
- 5.Volume and Turnover
- Transaction volume: The total number of stocks bought and sold on that day.
- Transaction amount: The sum of transaction volume and transaction price.
- Impact of trading volume: A large trading volume indicates an active market, and stock prices may fluctuate more.
The Underlying Logic of Stocks: Supply and Demand Determine Price
How do stocks rise and fall? Investors need to analyze a number of factors that affect the price of a stock.
1. How is the stock price formed?
The rise and fall of stocks comes from the struggle between the “buyers” and “sellers “:
- Buy orders > Sell orders, prices rise: When investors generally have a positive outlook on a certain stock, buying pressure increases, driving the price up.(For example: Foreign investors massively bought overweight Taiwan stock heavyweight stocks)
- Sell order > Buy order, price falls: When market confidence is insufficient, selling pressure increases, leading to a decline in stock prices.(For example: Geopolitical risks trigger retail investors to sell off.)
Different market rules may also affect the magnitude of fluctuations:
- Taiwan stocks: Common stocks fluctuate by 10%, emerging stocks by 20%
- S. stocks: No limit on price fluctuations, may experience sharp rises and falls in a single day
2. 4 Core Factors Affecting Stock Prices
| Factor Type | Specific cases |
| Overall Economy
|
GDP, CPI, and interest rate policies affect market trends.
Example: The central bank’s interest rate hike led to a decline in financial stocks |
| Industry Trends | The prospects of industrial development and market demand have a significant impact on the company’s stock price.
Example: Electric vehicle subsidy policy promotes related supply chains |
| Company Operations | Check the company’s revenue, net profit, and earnings per share (EPS).
Example: Hon Hai (2317) gross margin increase boosts stock price |
| Market Sentiment
|
Investor confidence and stock market enthusiasm affect the willingness to buy and sell stocks.
Example: Retail investor forums drive discussions on metaverse concept stocks |
Technical Analysis: Using Charts and Indicators to Predict Stock Rises and Falls
By studying historical market data such as stock prices and trading volumes, and using statistical and graphical analysis techniques, we can predict future price trends and assist investors in formulating buying and selling strategies. The main methods include candlestick charts, moving averages, relative strength index (RSI), and moving average convergence divergence (MACD). These tools reveal market trends and potential buy and sell signals through visualization and data calculations.
1. K-line Pattern Practical Teaching
The K-line chart, also known as the candlestick chart, is a commonly used chart type in technical analysis. Each K-line contains the opening price, closing price, highest price, and lowest price, reflecting price changes through different colors and shapes. Investors can identify market trends through K-line charts, such as upward trends, downward trends, or sideways consolidation. Trend lines are straight lines that connect price highs or lows, used to confirm support and resistance levels and to determine the possible direction of price movement.
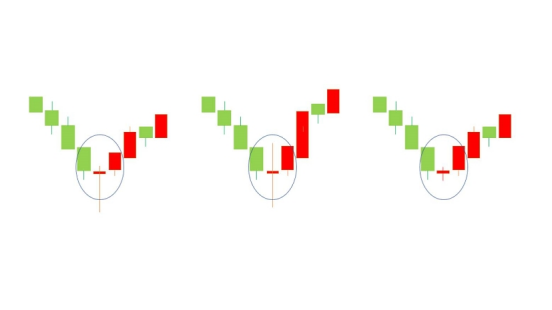
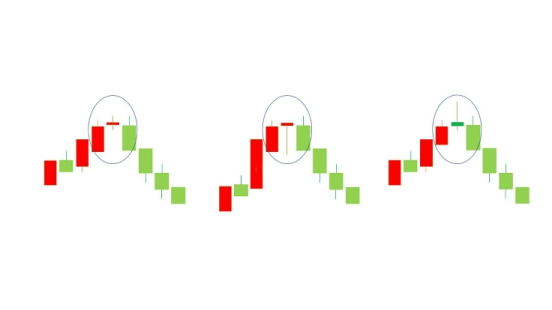
- Crosshairs:The appearance at a high point may indicate a reversal(Comparison of multiple time period candlestick charts)
- Morning/Evening Star:Three-day combination form judgment of bullish and bearish reversal
- Breakthrough neckline:W bottom/M top shape confirmation trend direction
2. 3 Application Techniques of Major Technical Indicators
- Moving Average (MA):
The moving average is the average of closing prices over a certain period, forming a smooth curve used to show price trends. Common moving averages include short-term (such as 5-day, 10-day), medium-term (such as 20-day, 50-day), and long-term (such as 100-day, 200-day) averages. When the short-term average crosses above the long-term average, it forms a “golden cross,” which may signal a buying opportunity; conversely, when the short-term average crosses below the long-term average, it forms a “death cross,” which may signal a selling opportunity. The moving average is suitable for determining market trends; when the price breaks through the MA, it often indicates a market reversal.
- Golden Cross (5-day line breaks above 20-day line) = short-term buy signal
- Death cross (5-day line falls below 60-day line) = trend weakening warning signal
tips:Ultima Markets supports adding averages with one click, and customizing cycles for quick validation.
- MACD Indicator:
MACD consists of the fast line (DIF), the slow line (DEA), and the histogram, used to determine price trends and momentum. When the DIF crosses above the DEA, it forms a “golden cross,” which may indicate a buy signal; conversely, when the DIF crosses below the DEA, it forms a “death cross,” which may indicate a sell signal. The histogram reflects the gap between the two lines, showing the strength of the trend. Using them in combination can more accurately capture short-term market fluctuations and breakout points.
- The column body changes from negative to positive → Bullish momentum strengthens
- Divergence (new high in stock price but MACD declining) = Potential selling opportunity
- RSI Relative Strength Index:
The RSI is a technical indicator that measures the speed and change of price movements, with values ranging between 0 and 100. Generally, an RSI above 70 is considered overbought, potentially indicating a price pullback, while below 30 is seen as oversold, possibly signaling a price rebound. Investors can use the RSI to determine if the market is in an extreme state, aiding in buy or sell decisions.
- RSI > 70 → Overbought area, consider taking profits
- RSI < 30 → Oversold area, look for rebound opportunities
3. Key Signals in the Volume-Value Relationship
- Price increase and volume increase:Trend health (for example: MediaTek (2454) surged with volume after the investor conference)
- Price drops with shrinking volume:Selling pressure eases, may stop falling
- Abnormal explosion volume:Main force entry and exit traces (using the main force capital flow toolfor monitoring)
Fundamental Analysis: Uncovering the Intrinsic Value of a Stock
1. Key points for interpreting financial report data
Analyzing the company’s financial statements, such as the income statement, balance sheet, and cash flow statement, can provide insights into the company’s profitability and financial health. Key indicators include earnings per share (EPS), price-to-earnings ratio (P/E), and return on equity (ROE), among others.
- Price-to-Earnings Ratio (PE):The average PE of the Taiwan stock market is about 15 times, and technology stocks can accept a higher valuation
- ROE Return on Equity:More than 15% indicates strong profitability for the company (e.g., Delta Electronics 2308)
- Free Cash Flow:Companies with positive cash flow are highly resistant to market downturns
2. Industry Cycles and Policy Implications
Macroeconomic indicators, such as GDP growth rate, inflation rate, and interest rates, affect overall market performance. In addition, industry development trends and competitive conditions also impact the performance of individual companies.
- Growth period: Semiconductor equipment demand explosion (e.g. Jingding 3413)
- Recession period: Traditional manufacturing industry faces inventory adjustment
- Policy dividends: Government green energy subsidies drive the wind power sector
tips:Ultima Markets Economic Calendar integrates global financial data to anticipate market fluctuations in advance!
Market Sentiment: An Invisible but Critical Driver of Rises and Falls
News events and market rumors may trigger fluctuations in investor sentiment, which in turn can affect stock prices. For example, significant policy changes, company merger news, or global economic events can lead to drastic market fluctuations. Therefore, investors should closely monitor relevant information and maintain rational judgment.
1. Emotion Quantification Tool
- VIX panic index: >40 indicates excessive market fear, which may lead to a bottom rebound
- Financing balance: The financing utilization rate of the Taiwan stock market > 60% requires caution for overheating
2. Newspaper event operation mindset
- Good news exhausted: The stock price fell after the announcement of the company’s merger and acquisition news
- Bearish consolidation:Earnings reports are worse than expected, but the stock price does not break the previous low
Risk Management: Response Strategies for Misjudging Price Movements
After understanding the concepts and techniques of stock price fluctuations, it is crucial to develop suitable investment strategies and risk management plans. Investors should choose long-term investment or short-term trading strategies based on their own risk tolerance. Additionally, setting profit-taking and stop-loss points and strictly adhering to them helps control potential losses. Diversifying investments across different industries and asset classes is also an effective way to reduce risk.
1. Stop Loss/Stop Profit Setting Principle
- Fixed ratio method: Losses up to 7% are immediately exited
- Wave Adjustment Method: Dynamically Set According to ATR Indicator
2. Warehouse Position Control Principles
- Rule of 333: single target <30%, single day trade <30% capital, 30% cash retained
- Pyramid Plus: Buy in batches after trend confirmation
tips:Ultima Markets one-click setting for trailing stop loss, automatically locking in profits and controlling risks!
Practical case: Comprehensive analysis of the rise and fall of Taiwan stocks and U.S. stocks
Case 1: TSMC (2330) technical reversal signal
Taking the Taiwan stock market in 2024 as an example, benefiting from the growth in demand for artificial intelligence-related hardware, TSMC’s stock price rose by 81% that year, marking its best annual performance since 1999. This shows that under the combination of technical analysis and fundamental analysis, investors can capture opportunities for market upswings.
Case 2: NVIDIA (NVDA) Financial Report Trading Operations
- Preliminary analysis: AI chip demand growth, PE lower than peers
- Data validation: Revenue year-on-year growth rate > 50%, gross profit margin improvement
- Result: The stock price rose 8% in a single day after the financial report was released
The Necessity of Rationally Using Tools in the Stock Market: Utilizing Technology to Overcome Human Weaknesses
When investing in stocks, obtaining real-time and professional market analysis is crucial for making informed trading decisions. Ultima Markets understands the needs of investors and has specifically integrated Trading Central‘s top analytical tools to provide clients with professional technical analysis and trading strategy recommendations. Through Trading Central’s technical insights, investors can gain clear trend lines, key price levels, and technical conditions, easily interpret market trends, and take action in real time.
1.Trading Central Intelligent Analysis Tool
- Data integration efficiency: Simultaneously monitor Taiwan stocks, U.S. stocks, and foreign exchange markets to avoid missing cross-market linkage opportunities
- Decision objectivity: Use technical indicator signals to filter emotional trading (e.g.: automatically remind to reduce positions when RSI is overbought)
- Strategy backtesting validation: Testing the win rates of methods such as “moving average crossover” and “MACD divergence” through historical data
2.Expert Advisor (EA) Functions
The MetaTrader 4 (MT4) trading platform supports the Expert Advisor (EA) feature, allowing investors to use automated trading robots to create personalized automated trading strategies. This not only enhances trading efficiency but also enables investors to respond quickly to market fluctuations and seize trading opportunities.
Ultima Markets offers a free technical indicator library and advanced top features. Click to register to unlock all system tools!
Conclusion: 3 Steps to Improve Stock Market Trend Judgment
- 1.Establish an analytical framework: Technical aspect (40%) + Fundamental aspect (40%) + Sentiment aspect (20%)
- 2.Make good use of intelligent tools: Ultima Markets offers over 50 types of technical indicators and financial databases
- 3.Demo Verification Strategy: Open an Ultima Markets Demo Accountand test trading programs at no cost
Take action now!
Click to register an trading account,free to use:
✅Real-time Taiwan stock market, U.S. stock market quotes
✅ Professional K-line charts and technical indicators
✅ Economic calendar and news impact analysis
✅ Simulated trading practice environment
Master the key to stock price fluctuations and start building your investment advantage now!
Glossary
Get started or expand your knowledge of trading at any level with a wealth of financial industry terms and definitions that you won’t find anywhere else.
- A
- B
- C
- D
- E
- F
- G
- H
- I
- J
- K
- L
- M
- N
- O
- P
- Q
- R
- S
- T
- U
- V
- W
- X
- Y
- Z
Bookmarked Trading Term(s)

Glossary
- A
- B
- C
- D
- E
- F
- G
- H
- I
- J
- K
- L
- M
- N
- O
- P
- Q
- R
- S
- T
- U
- V
- W
- X
- Y
- Z
-
AMM (Automated Money Market)
A decentralized system that uses algorithms to automatically manage liquidity and trading in financial markets without traditional market makers.
Bookmark
-
APR (Annual Percentage Rate)
The yearly interest rate a trader pays on borrowed funds or e arns on investments, excluding compounding.
Bookmark
-
APY (Annual Percentage Yield)
The yearly interest rate a trader earns, including compounding, which reflects the real return on an investment.
Bookmark
-
Asymmetric Cryptography
A security method using two different keys (public and private) to encrypt and decrypt data, ensuring secure transactions.
Bookmark
-
Asymmetric Encryption
The apportionment of premiums and discounts on forward exchange transactions that relate directly to deposit swap (interest arbitrage) deals, over the period of each deal.
Bookmark
-
Atomic Swap
A direct peer-to-peer exchange of different cryptocurrencies without the need for intermediaries, reducing counterparty risk.
Bookmark
-
Balance Of Trade
The value of a country's exports minus its imports.
Bookmark
-
Bar Chart
A type of chart which consists of four significant points: the high and the low prices, which form the vertical bar; the opening price, which is marked with a horizontal line to the left of the bar; and the closing price, which is marked with a horizontal line to the right of the bar.
Bookmark
-
Barrier Level
A certain price of great importance included in the structure of a Barrier Option. If a Barrier Level price is reached, the terms of a specific Barrier Option call for a series of events to occur.
Bookmark
-
Barrier Option
Any number of different option structures (such as knock-in, knock-out, no touch, double-no-touch-DNT) that attaches great importance to a specific price trading. In a no-touch barrier, a large defined payout is awarded to the buyer of the option by the seller if the strike price is not 'touched' before expiry. This creates an incentive for the option seller to drive prices through the strike level and creates an incentive for the option buyer to defend the strike level.
Bookmark
-
Base Currency
The first currency in a currency pair. It shows how much the base currency is worth as measured against the second currency. For example, if the USD/CHF (U.S. Dollar/Swiss Franc) rate equals 1.6215, then one USD is worth CHF 1.6215. In the forex market, the US dollar is normally considered the base currency for quotes, meaning that quotes are expressed as a unit of $1 USD per the other currency quoted in the pair. The primary exceptions to this rule are the British pound, the euro and the Australian dollar.
Bookmark
-
Cable
The GBP/USD (Great British Pound/U.S. Dollar) pair. Cable earned its nickname because the rate was originally transmitted to the US via a transatlantic cable beginning in the mid 1800s when the GBP was the currency of international trade.
Bookmark
-
Cad
The Canadian dollar, also known as Loonie or Funds.
Bookmark
-
Call Option
A currency trade which exploits the interest rate difference between two countries. By selling a currency with a low rate of interest and buying a currency with a high rate of interest, the trader will receive the interest difference between the two countries while this trade is open.
Bookmark
-
Canadian Ivey Purchasing Managers (Cipm) Index
A monthly gauge of Canadian business sentiment issued by the Richard Ivey Business School.
Bookmark
-
Candlestick Chart
A chart that indicates the trading range for the day as well as the opening and closing price. If the open price is higher than the close price, the rectangle between the open and close price is shaded. If the close price is higher than the open price, that area of the chart is not shaded.
Bookmark
-
Day Trader
Speculators who take positions in commodities and then liquidate those positions prior to the close of the same trading day.
Bookmark
-
Day Trading
Making an open and close trade in the same product in one day.
Bookmark
-
Deal
A term that denotes a trade done at the current market price. It is a live trade as opposed to an order.
Bookmark
-
Dealer
An individual or firm that acts as a principal or counterpart to a transaction. Principals take one side of a position, hoping to earn a spread (profit) by closing out the position in a subsequent trade with another party. In contrast, a broker is an individual or firm that acts as an intermediary, putting together buyers and sellers for a fee or commission.
Bookmark
-
Dealing Spread
The difference between the buying and selling price of a contract.
Bookmark
-
Ecb
European Central Bank, the central bank for the countries using the euro.
Bookmark
-
Economic Indicator
A government-issued statistic that indicates current economic growth and stability. Common indicators include employment rates, Gross Domestic Product (GDP), inflation, retail sales, etc.
Bookmark
-
End Of Day Order (eod)
An order to buy or sell at a specified price that remains open until the end of the trading day.
Bookmark
-
Est/Edt
The time zone of New York City, which stands for United States Eastern Standard Time/Eastern Daylight time.
Bookmark
-
Estx50
A name for the Euronext 50 index.
Bookmark
-
Factory Orders
The dollar level of new orders for both durable and nondurable goods. This report is more in depth than the durable goods report which is released earlier in the month.
Bookmark
-
Fed
The Federal Reserve Bank, the central bank of the United States, or the FOMC (Federal Open Market Committee), the policy-setting committee of the Federal Reserve.
Bookmark
-
Fed Officials
Refers to members of the Board of Governors of the Federal Reserve or regional Federal Reserve Bank Presidents.
Bookmark
-
Figure/The Figure
Refers to the price quotation of '00' in a price such as 00-03 (1.2600-03) and would be read as 'figure-three.' If someone sells at 1.2600, traders would say 'the figure was given' or 'the figure was hit.
Bookmark
-
Fill
When an order has been fully executed.
Bookmark
-
G7
Group of 7 Nations - United States, Japan, Germany, United Kingdom, France, Italy and Canada.
Bookmark
-
G8
Group of 8 - G7 nations plus Russia.
Bookmark
-
Gap Gapping
A quick market move in which prices skip several levels without any trades occurring. Gaps usually follow economic data or news announcements.
Bookmark
-
Gearing (Also Known As Leverage)
Gearing refers to trading a notional value that is greater than the amount of capital a trader is required to hold in his or her trading account. It is expressed as a percentage or a fraction.
Bookmark
-
Ger30
An index of the top 30 companies (by market capitalization) listed on the German stock exchange – another name for the DAX.
Bookmark
-
Handle
Every 100 pips in the FX market starting with 000.
Bookmark
-
Hawk/Hawkish
A country's monetary policymakers are referred to as hawkish when they believe that higher interest rates are needed, usually to combat inflation or restrain rapid economic growth or both.
Bookmark
-
Hedge
A position or combination of positions that reduces the risk of your primary position.
Bookmark
-
Hit The Bid
To sell at the current market bid.
Bookmark
-
Hk50/Hkhi
Names for the Hong Kong Hang Seng index.
Bookmark
-
Illiquid
Little volume being traded in the market; a lack of liquidity often creates choppy market conditions.
Bookmark
-
Imm
The IMM, or International Monetary Market, is a part of the Chicago Mercantile Exchange (CME) that deals with trading currency and interest rate futures and options.
Bookmark
-
Imm Futures
A traditional futures contract based on major currencies against the US dollar. IMM futures are traded on the floor of the Chicago Mercantile Exchange.
Bookmark
-
Imm Session
8:00am - 3:00pm New York.
Bookmark
-
Indu
Abbreviation for the Dow Jones Industrial Average.
Bookmark
-
Japanese Economy Watchers Survey
Measures the mood of businesses that directly service consumers such as waiters, drivers and beauticians. Readings above 50 generally signal improvements in sentiment.
Bookmark
-
Japanese Machine Tool Orders
Measures the total value of new orders placed with machine tool manufacturers. Machine tool orders are a measure of the demand for companies that make machines, a leading indicator of future industrial production. Strong data generally signals that manufacturing is improving and that the economy is in an expansion phase.
Bookmark
-
Jpn225
A name for the NEKKEI index.
Bookmark
-
Keep The Powder Dry
To limit your trades due to inclement trading conditions. In either choppy or extremely narrow markets, it may be better to stay on the sidelines until a clear opportunity arises.
Bookmark
-
Kiwi
Nickname for NZD/USD (New Zealand Dollar/U.S. Dollar).
Bookmark
-
Knock-Ins
Option strategy that requires the underlying product to trade at a certain price before a previously bought option becomes active. Knock-ins are used to reduce premium costs of the underlying option and can trigger hedging activities once an option is activated.
Bookmark
-
Knock-Outs
Option that nullifies a previously bought option if the underlying product trades a certain level. When a knock-out level is traded, the underlying option ceases to exist and any hedging may have to be unwound.
Bookmark
-
Last Dealing Day
The last day you may trade a particular product.
Bookmark
-
Last Dealing Time
The last time you may trade a particular product.
Bookmark
-
Leading Indicators
Statistics that are considered to predict future economic activity.
Bookmark
-
Level
A price zone or particular price that is significant from a technical standpoint or based on reported orders/option interest.
Bookmark
-
Leverage
Also known as margin, this is the percentage or fractional increase you can trade from the amount of capital you have available. It allows traders to trade notional values far higher than the capital they have. For example, leverage of 100:1 means you can trade a notional value 100 times greater than the capital in your trading account.*
Bookmark
-
Macro
The longest-term trader who bases their trade decisions on fundamental analysis. A macro trade’s holding period can last anywhere from around six months to multiple years.
Bookmark
-
Manufacturing Production
Measures the total output of the manufacturing aspect of the Industrial Production figures. This data only measures the 13 sub-sectors that relate directly to manufacturing. Manufacturing makes up approximately 80% of total Industrial Production.
Bookmark
-
Market Call
A request from a broker or dealer for additional funds or other collateral on a position that has moved against the customer.
Bookmark
-
Market Maker
A dealer who regularly quotes both bid and ask prices and is ready to make a two-sided market for any financial product.
Bookmark
-
Market Order
An order to buy or sell at the current price.
Bookmark
-
Nas100
An abbreviation for the NASDAQ 100 index.
Bookmark
-
Net Position
The amount of currency bought or sold which has not yet been offset by opposite transactions.
Bookmark
-
New York Session
8:00am – 5:00pm (New York time).
Bookmark
-
No Touch
An option that pays a fixed amount to the holder if the market never touches the predetermined Barrier Level.
Bookmark
-
Nya.X
Symbol for NYSE Composite index.
Bookmark
-
Offer (Also Known As The Ask Price)
The price at which the market is prepared to sell a product. Prices are quoted two-way as Bid/Offer. The Offer price is also known as the Ask. The Ask represents the price at which a trader can buy the base currency, which is shown to the right in a currency pair. For example, in the quote USD/CHF 1.4527/32, the base currency is USD, and the ask price is 1.4532, meaning you can buy one US dollar for 1.4532 Swiss francs.
In CFD trading, the Ask represents the price a trader can buy the product. For example, in the quote for UK OIL 111.13/111.16, the product quoted is UK OIL and the ask price is £111.16 for one unit of the underlying market.
Bookmark
-
Offered
If a market is said to be trading offered, it means a pair is attracting heavy selling interest, or offers.
Bookmark
-
Offsetting Transaction
A trade that cancels or offsets some or all of the market risk of an open position.
Bookmark
-
On Top
Attempting to sell at the current market order price.
Bookmark
-
One Cancels The Other Order (oco)
A designation for two orders whereby if one part of the two orders is executed, then the other is automatically cancelled.
Bookmark
-
Paid
Refers to the offer side of the market dealing.
Bookmark
-
Pair
The forex quoting convention of matching one currency against the other.
Bookmark
-
Paneled
A very heavy round of selling.
Bookmark
-
Parabolic
A market that moves a great distance in a very short period of time, frequently moving in an accelerating fashion that resembles one half of a parabola. Parabolic moves can be either up or down.
Bookmark
-
Partial Fill
When only part of an order has been executed.
Bookmark
-
Quantitative Easing
When a central bank injects money into an economy with the aim of stimulating growth.
Bookmark
-
Quarterly Cfds
When a central bank injects money into an economy with the aim of stimulating growth.
Bookmark
-
Quote
An indicative market price, normally used for information purposes only.
Bookmark
-
Rally
A recovery in price after a period of decline.
Bookmark
-
Range
When a price is trading between a defined high and low, moving within these two boundaries without breaking out from them.
Bookmark
-
Rate
The price of one currency in terms of another, typically used for dealing purposes.
Bookmark
-
Rba
Reserve Bank of Australia, the central bank of Australia.
Bookmark
-
Rbnz
Reserve Bank of New Zealand, the central bank of New Zealand.
Bookmark
-
Sec
The Securities and Exchange Commission.
Bookmark
-
Sector
A group of securities that operate in a similar industry.
Bookmark
-
Sell
Taking a short position in expectation that the market is going to go down.
Bookmark
-
Settlement
The process by which a trade is entered into the books, recording the counterparts to a transaction. The settlement of currency trades may or may not involve the actual physical exchange of one currency for another.
Bookmark
-
Shga.X
Symbol for the Shanghai A index
Bookmark
-
Takeover
Assuming control of a company by buying its stock.
Bookmark
-
Technical Analysis
The process by which charts of past price patterns are studied for clues as to the direction of future price movements.
Bookmark
-
Technicians/techs
Traders who base their trading decisions on technical or charts analysis.
Bookmark
-
Ten (10) Yr
US government-issued debt which is repayable in ten years. For example, a US 10-year note.
Bookmark
-
Thin
A illiquid, slippery or choppy market environment. A light-volume market that produces erratic trading conditions.
Bookmark
-
Ugly
Describing unforgiving market conditions that can be violent and quick.
Bookmark
-
Uk Average Earnings Including Bonus/ Excluding Bonus
Measures the average wage including/excluding bonuses paid to employees. This is measured quarter-on-quarter (QoQ) from the previous year.
Bookmark
-
Uk Claimant Count Rate
Measures the number of people claiming unemployment benefits. The claimant count figures tend to be lower than the unemployment data since not all of the unemployed are eligible for benefits.
Bookmark
-
Uk Hbos House Price Index
Measures the relative level of UK house prices for an indication of trends in the UK real estate sector and their implication for the overall economic outlook. This index is the longest monthly data series of any UK housing index, published by the largest UK mortgage lender (Halifax Building Society/Bank of Scotland).
Bookmark
-
Uk Jobless Claims Change
Measures the change in the number of people claiming unemployment benefits over the previous month.
Bookmark
-
Value Date
Also known as the maturity date, it is the date on which counterparts to a financial transaction agree to settle their respective obligations, i.e., exchanging payments. For spot currency transactions, the value date is normally two business days forward.
Bookmark
-
Variation Margin
Funds traders must hold in their accounts to have the required margin necessary to cope with market fluctuations.
Bookmark
-
Vix Or Volatility Index
Shows the market's expectation of 30-day volatility. It is constructed using the implied volatilities of a wide range of S&P 500 index options. The VIX is a widely used measure of market risk and is often referred to as the "investor fear gauge."
Bookmark
-
Volatility
Referring to active markets that often present trade opportunities.
Bookmark
-
Wedge Chart Pattern
Chart formation that shows a narrowing price range over time, where price highs in an ascending wedge decrease incrementally, or in a descending wedge, price declines are incrementally smaller. Ascending wedges typically conclude with a downside breakout and descending wedges typically terminate with upside breakouts.
Bookmark
-
Whipsaw
Slang for a highly volatile market where a sharp price movement is quickly followed by a sharp reversal.
Bookmark
-
Wholesale Price
Measures the changes in prices paid by retailers for finished goods. Inflationary pressures typically show earlier than the headline retail.
Bookmark
-
Working Order
Where a limit order has been requested but not yet filled.
Bookmark
-
Wsj
Acronym for The Wall Street Journal.
Bookmark
-
Xag/Usd
Symbol for Silver Index.
Bookmark
-
Xau/Usd
Symbol for Gold Index.
Bookmark
-
Xax.X
Symbol for AMEX Composite Index.
Bookmark
-
YER
Yemeni Rial. The currency of Yemen. It is subdivided into 100 fils.
Bookmark
-
Yemeni Rial
See YER.
Bookmark
-
Yen
See JPY.
Bookmark
-
Yield
Yield is the return on an investment and is usually expressed as a percentage.
Bookmark
-
Yuan Renminbi
See CNY
Bookmark
-
ZAR
Rand. The currency of South Africa. It is subdivided into 100 cents.
Bookmark
-
ZMW
Zambian Kwacha. The currency of Zambia. It is subdivided into 100 Ngwee.
Bookmark
-
ZWL
Zimbabwe Dollar. The currency of Zimbabwe. It is subdivided into 100 cents.
Bookmark
-
Zambian Kwacha
See ZMW.
Bookmark
-
ZigZag
A technical indicator that draws tops and bottoms - filtering out noise.
Bookmark
-
Zimbabwe Dollar
See ZWL.
Bookmark
Bookmarked Trading Term(s)
Cancel
Confirm
FOLLOW US


Ultima Markets is a member of The Financial Commission, an international independent body responsible for resolving disputes in the Forex and CFD markets.
All clients of Ultima Markets are protected under insurance coverage provided by Willis Towers Watson (WTW), a global insurance brokerage established in 1828, with claims eligibility up to US$1,000,000 per account.
Ultima Markets is the first CFD broker to be part of United Nations Global Compact.
FOLLOW US
TRADE WITH US
RISK DISCLOSURE
Risk Warning: Trading Forex and CFDs carries the risk of losing substantially more than your initial investment and should only be traded with money you can afford to lose. You do not own or have any rights to the assets that underlying the derivatives (such as the right to receive dividend payments). Ensure you fully understand the risks involved. Trading leveraged products may not be suitable for all investors. Before trading, please take into consideration your level of experience, investment objectives and seek independent financial advice if necessary. Please consider our legal documents and ensure that you fully understand the risks before you make any trading decisions.
General Advice Warning: The information on this website is a general nature only and any advice has been prepared without taking account of your objectives, financial situation or needs. Accordingly, before acting on the advice, you should consider the appropriateness of any advice having regard to your objectives, financial situation and needs, and after considering the legal documents.
Regional Restrictions:This information or devices on this website is not directed or offered to residents of certain jurisdictions such as the United States, North Korea etc. For more information, please contact our customer support team.
Ultima Markets, a trading name of Ultima Markets Ltd, is authorized and regulated by the Financial Services Commission "FSC" of Mauritius as an Investment Dealer (Full-Service Dealer, excluding Underwriting) (license No. GB 23201593). The registered office address: 2nd Floor, The Catalyst, 40 Silicon Avenue, Ebene Cybercity, 72201, Mauritius.
Huaprime EU Ltd, registered number HE423188, and, with a business address at Georgiou Griva Digeni 122A, Kallinicos Court, Shop 1—Upper level, Neapolis, 3101 Limassol, Cyprus, is regulated by the Cyprus Securities and Exchange Commission, which has CIF license number 426/23.
Copyright © 2025 Ultima Markets Ltd. All rights reserved.
-

Messenger


Continue on Messenger
Take the conversation to your Messenger account. You can return anytime.
Scan the QR code and then send the message that appears in your Messenger.
Open Messenger on this device.
-
Instagram
Continue on Instagram
Take the conversation to your Instagram account. You can return anytime.
Scan the QR code to open Instagram. Follow @ultima_markets to send a DM.
Open Instagram on this device.
-
Live Chat
-